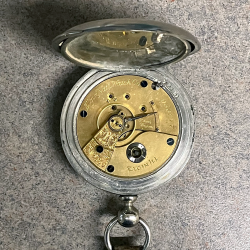
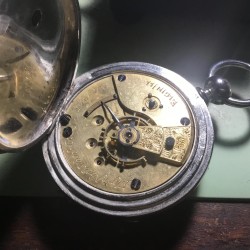
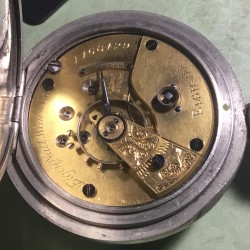
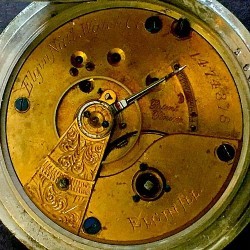
Pocket Watch Database

Elgin Grade 13 Production Charts

Note: Production dates are estimations but should be accurate within +/- 3 years.

[1873,1874,1875,1876,1877,1878,1879,1880,1881,1882,1883,1884,1885,1886,1887]
[1000,1000,0,2500,2000,26500,0,7000,5000,10000,30000,10000,25000,5000,30000]


Elgin National Watch Co. Grade 13 Production Map Relative to Company Lifespan

Start of Production
End of Production


Grade Production Runs Lowest Highest Start End Profile Code/Image
13 155,000 38 238,001 2,040,000 1873 1887
142,500 33 238,001 2,040,000 1873 1887 18s-M1-11j-HGK-U-
1,000 238,001 239,000 1873
1,000 397,001 398,000 1874
1,000 449,001 450,000 1876
1,000 481,001 482,000 1877
1,000 484,001 485,000 1877
1,000 524,001 525,000 1878
1,000 527,001 528,000 1878
1,000 530,001 531,000 1878
1,000 532,001 533,000 1878
2,000 535,001 537,000 1878
2,000 540,001 542,000 1878
1,000 543,001 544,000 1878
1,000 545,001 546,000 1878
3,000 547,001 550,000 1878
2,000 551,001 553,000 1878
2,000 554,001 556,000 1878
500 559,501 560,000 1878
5,000 565,001 570,000 1878
5,000 810,001 815,000 1881
5,000 905,001 910,000 1882
5,000 965,001 970,000 1882
5,000 1,050,001 1,055,000 1883
5,000 1,135,001 1,140,000 1883
10,000 1,160,001 1,170,000 1883
10,000 1,240,001 1,250,000 1883
10,000 1,470,001 1,480,000 1884
10,000 1,600,001 1,610,000 1885
5,000 1,615,001 1,620,000 1885
5,000 1,675,001 1,680,000 1885
5,000 1,850,001 1,855,000 1885
5,000 1,920,001 1,925,000 1886
20,000 2,000,001 2,020,000 1887
10,000 2,030,001 2,040,000 1887
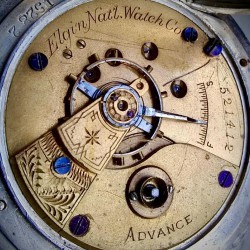
10,500 4 478,501 730,000 1876 1880 18s-M1-11j-HGK-U-Advance
1,500 478,501 480,000 1876
2,000 521,001 523,000 1878
2,000 557,001 559,000 1878
5,000 725,001 730,000 1880
2,000 1 708,001 710,000 1880 1880 18s-M1-11j-HGK-U-Mixed
2,000 708,001 710,000 1880