Pocket Watch Database

South Bend Grade 411 Production Charts

Note: Production dates are estimations but should be accurate within +/- 3 years.

[1910,1911,1912,1913,1914,1915,1916,1917,1918,1919,1920,1921,1922,1923,1924,1925,1926,1927,1928]
[2000,0,1000,1000,3000,1000,1000,3000,1000,3000,3000,2000,3000,3000,5000,5000,5000,0,5000]


South Bend Watch Co. Grade 411 Production Map Relative to Company Lifespan

Start of Production
End of Production


Grade Production Runs Lowest Highest Start End Profile Code/Image
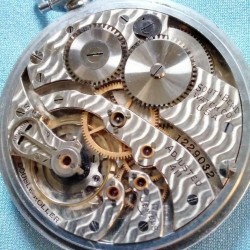
411 47,000 31 623,001 1,233,000 1910 1928
1,000 623,001 624,000 1910
1,000 637,001 638,000 1910
1,000 716,001 717,000 1912
1,000 795,001 796,000 1913
1,000 799,001 800,000 1914
1,000 804,001 805,000 1914
1,000 809,001 810,000 1914
1,000 822,001 823,000 1915
1,000 844,001 845,000 1916
1,000 861,001 862,000 1917
1,000 867,001 868,000 1917
1,000 875,001 876,000 1917
1,000 884,001 885,000 1918
1,000 904,001 905,000 1919
1,000 907,001 908,000 1919
1,000 933,001 934,000 1919
1,000 948,001 949,000 1920
1,000 959,001 960,000 1920
1,000 971,001 972,000 1920
1,000 985,001 986,000 1921
1,000 993,001 994,000 1921
1,000 1,001,001 1,002,000 1922
1,000 1,020,001 1,021,000 1922
1,000 1,023,001 1,024,000 1922
1,000 1,036,001 1,037,000 1923
1,000 1,046,001 1,047,000 1923
1,000 1,049,001 1,050,000 1923
5,000 1,083,001 1,088,000 1924
5,000 1,113,001 1,118,000 1925
5,000 1,153,001 1,158,000 1926
5,000 1,228,001 1,233,000 1928